Evaluations
Overview
An AutoML Evaluation allows you to evaluate a tuned model’s effectiveness at scale with a click of a button. Today, AutoML offers the Hive Vision Language Model (VLM) as the model of choice for evaluations. For more information on evaluations using the new VLM, see Hive Vision Language Model.
Evaluation Supported Snapshot Types
AutoML currently supports three snapshot types for evaluations:
| Snapshot Type | Description |
|---|---|
| Vision Language Model | Snapshot used to evaluate the Vision Language Model across video, image and text data. |
| Image Classification | Snapshot used to evaluate the Vision Language Model across image data. |
| Text Classification | Snapshot used to evaluate the Vision Language Model across text data. |
Create Evaluation
Once your snapshot is created, there are several ways to evaluate a model with it. The simplest is to click the Create Evaluation button on your newly created snapshot in the dataset Snapshots tab. The evaluation creation form is pre-filled with the corresponding snapshot and Hive’s Vision Language Model that has been thoroughly tested by our team to perform well.
Use an example prompt or create your own custom prompt based on your corporate classification policy and hit Start Evaluation to begin evaluating.
Once the evaluation completes, you can view the finalized metrics for your evaluation in the Results tab.
| AutoML Evaluations Page | Create New Evaluation Page |
|---|---|
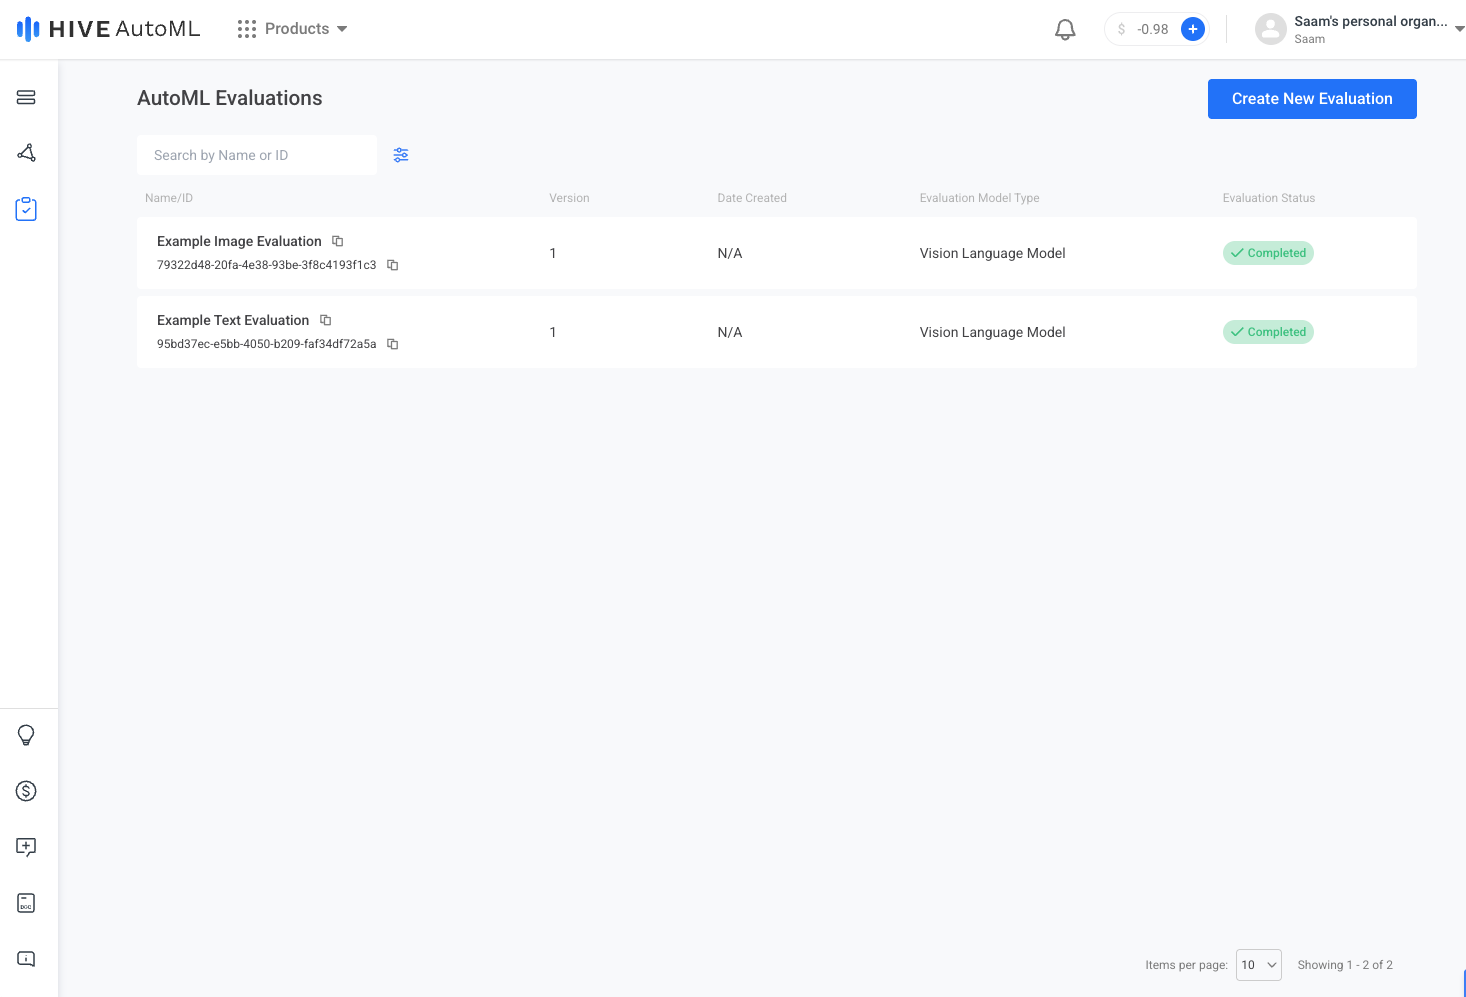 | 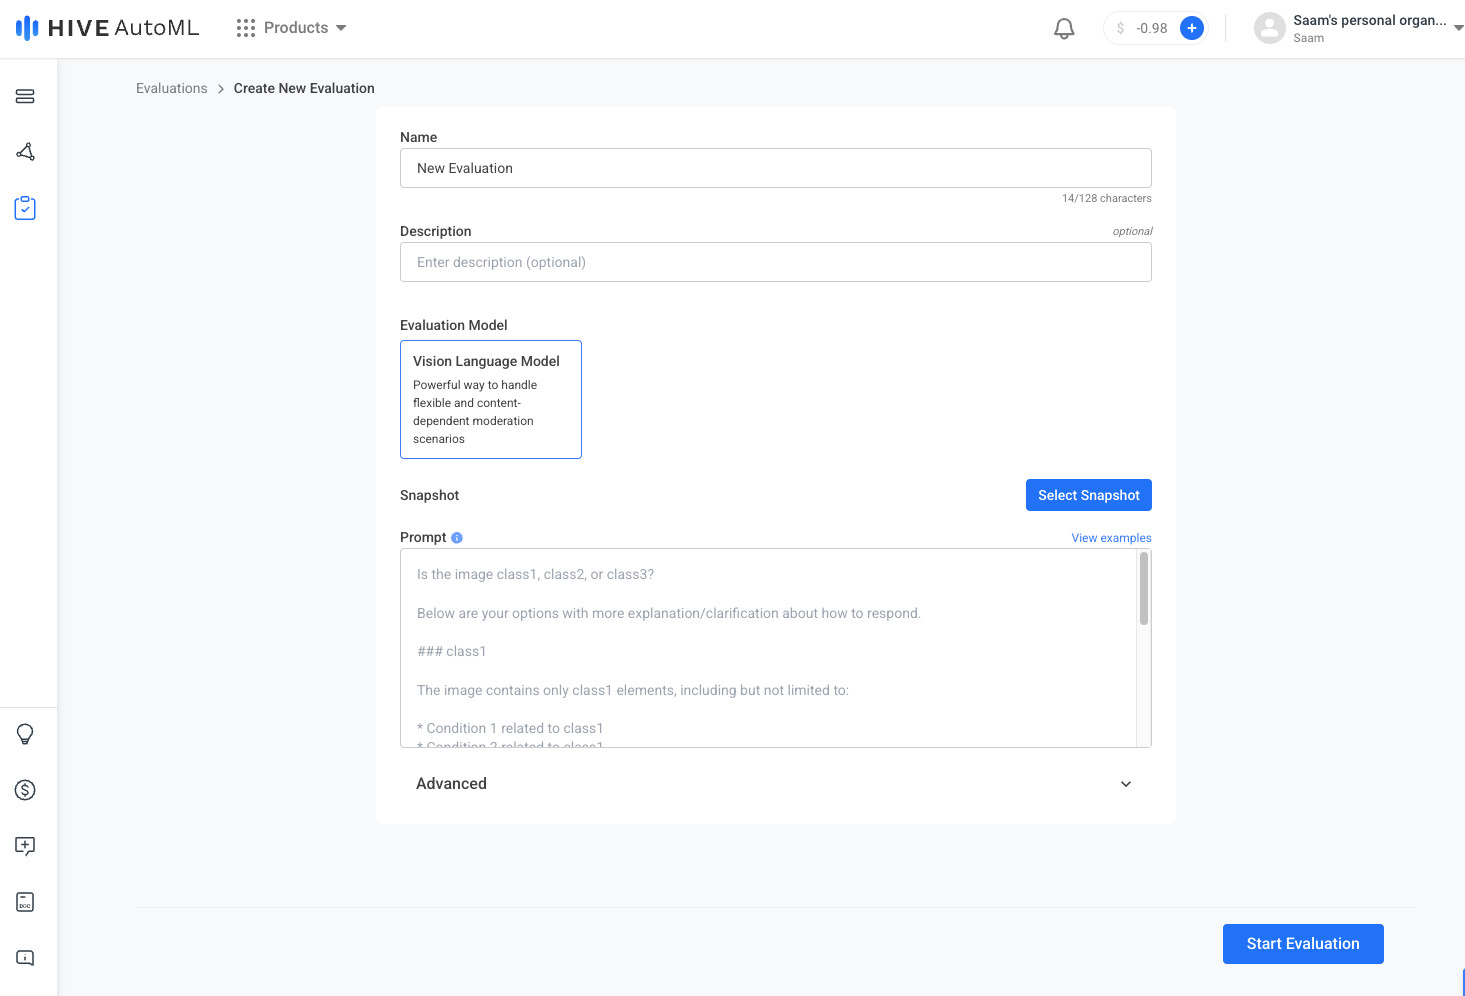 |
Evaluation Results Page | Evaluation Prompt Page |
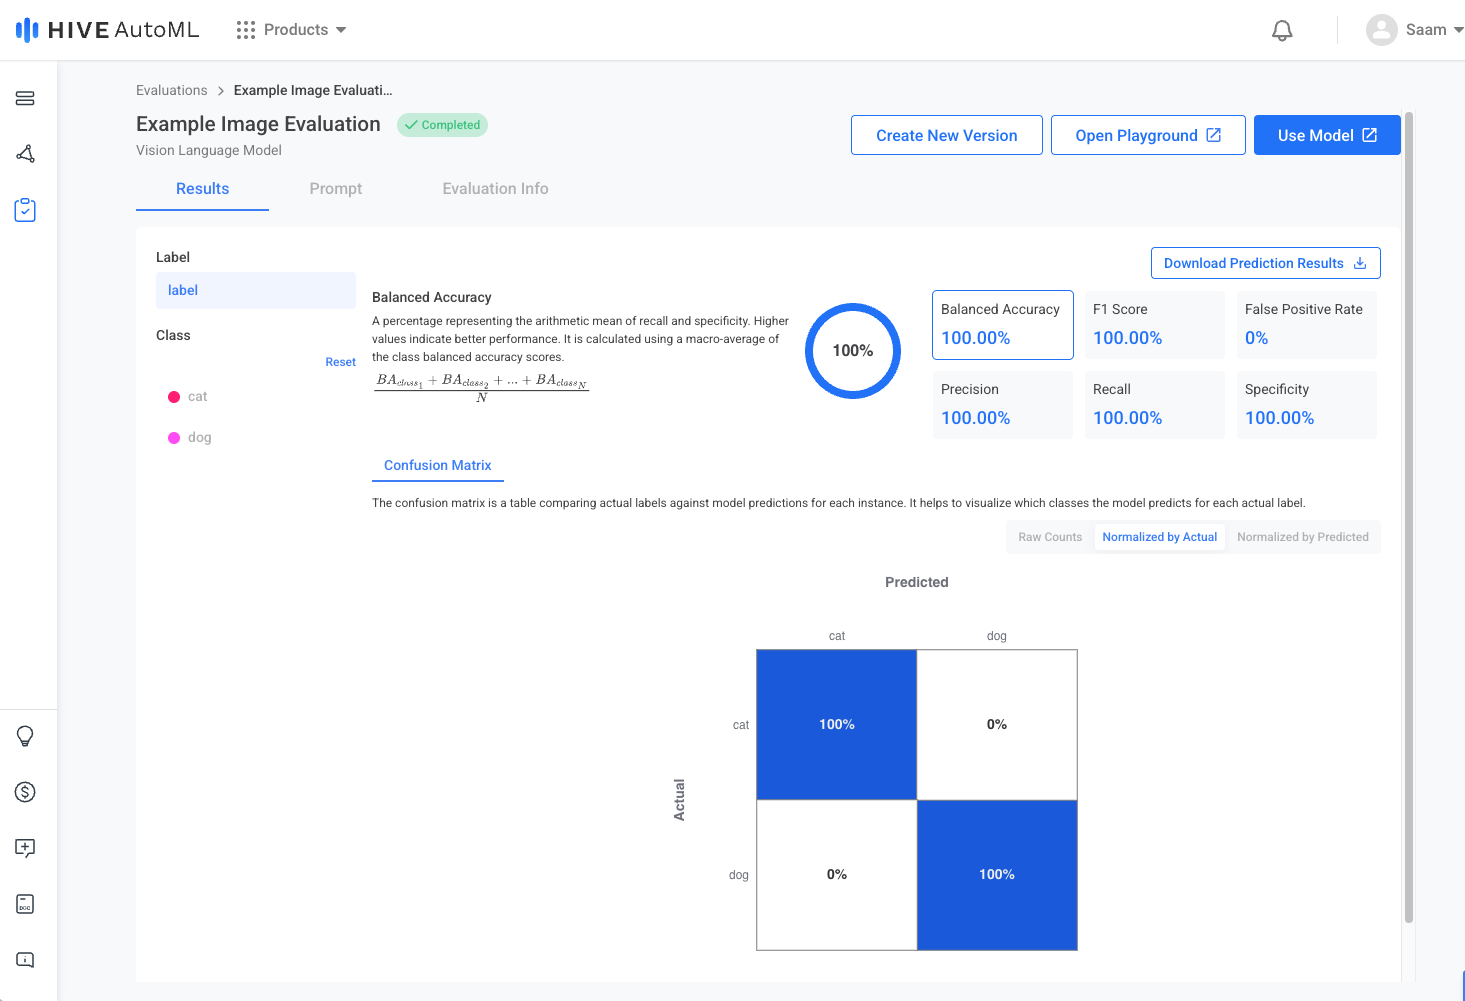 | 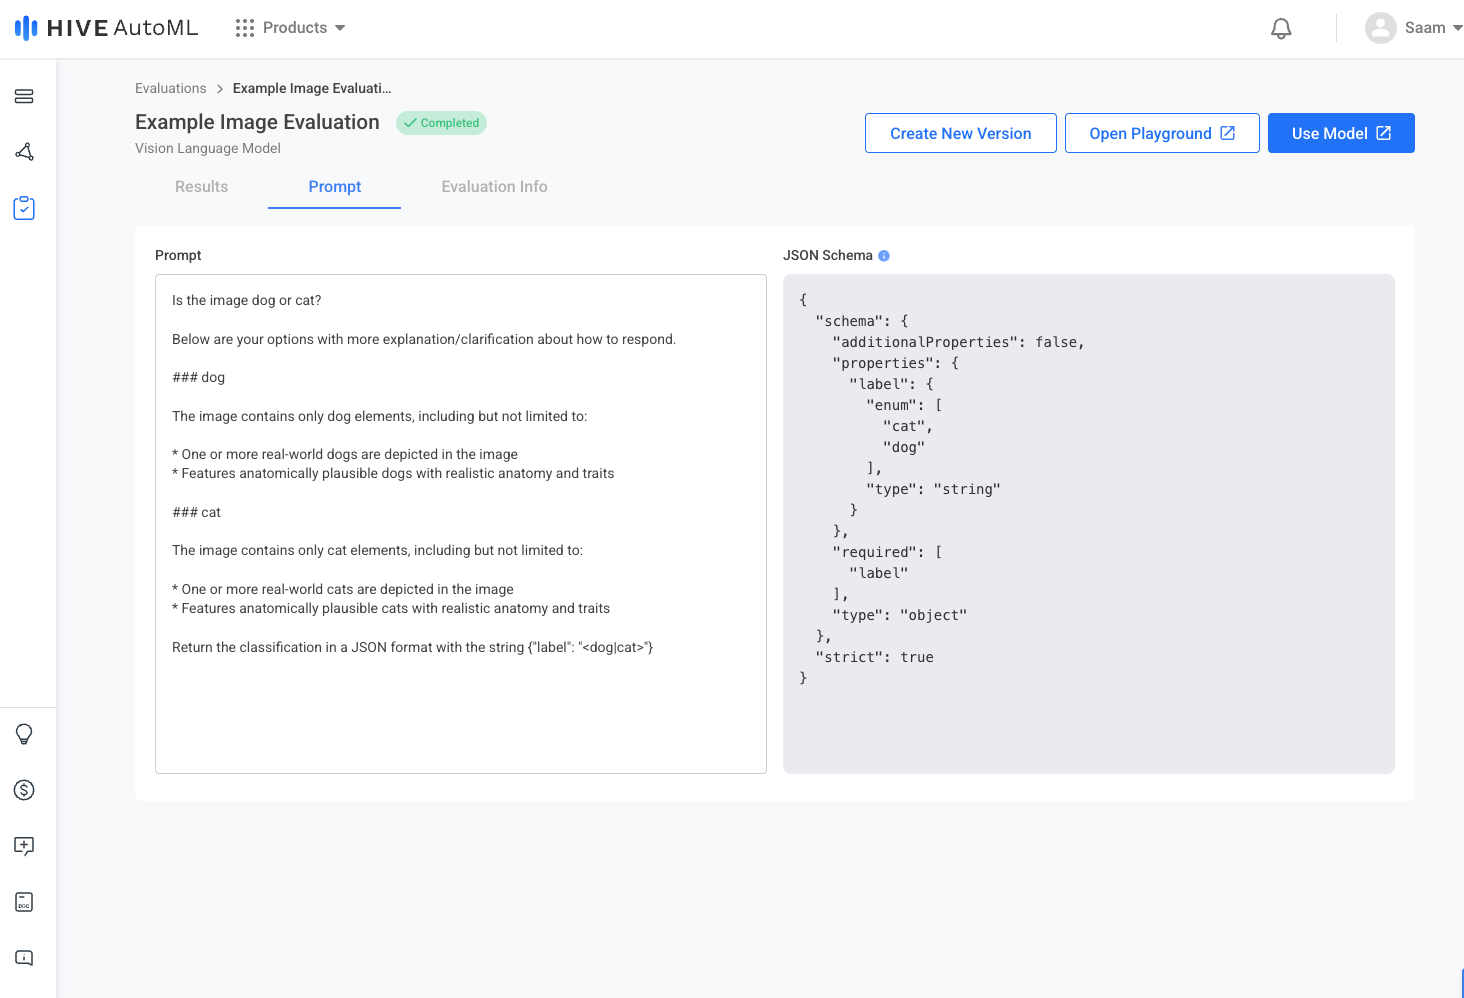 |
Evaluation Results
After an evaluation, several metrics are available to track progress and measure the final performance of your prompt policy. The performance metrics currently supported on AutoML are available below.
| Metric | Description |
|---|---|
| Balanced Accuracy | A percentage representing the average of recall and specificity. Higher values indicate better alignment for both positive and negative results. Balanced accuracy is calculated with the formula |
| F1 Score | A percentage representing the harmonic mean of the precision and recall. Higher values indicate better alignment of positive results. F1 score is calculated with the formula |
| Precision | A percentage representing the quality of positive results with respect to predicted classes at a specific confidence threshold. Higher values indicate fewer false positives. Precision is calculated with the formula |
| Recall | A percentage representing the quality of positive results with respect to actual classes at a specific confidence threshold. Higher values indicate fewer false negatives. Precision is calculated with the formula |
| Specificity | A percentage representing the quality of negative results with respect to actual classes. Higher values indicate fewer false positives. Specificity is calculated with the formula |
| Loss | A positive float value that represents how well the predicted results match the expected results. Lower values indicate better alignment. |
| Confusion Matrix | The confusion matrix is a table comparing actual labels against model predictions for each instance. It helps to visualize which classes the model predicts for each actual label. |
Video Walkthrough
Deployment
Deployment is the process of preparing your model to support inference requests via the Hive API. AutoML’s VLM deployment process is simple and can be leveraged quickly. See the Hive Vision Language Model Deployment documentation to integrate with the newest version of the VLM.
Updated 8 months ago